

In Section 6.5 .2 Computation Lab: Normal Plots in Unreplicated Factorial Designs, the factorial effects were sorted
Question:
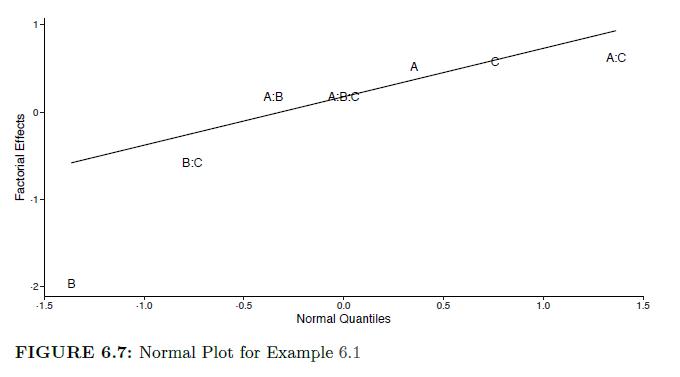
In Section 6.5 .2 Computation Lab: Normal Plots in Unreplicated Factorial Designs, the factorial effects were sorted based on their magnitudes before plotting the normal quantile plot shown in Figure 6.7 .
a. Create the normal quantile plot without sorting the factorial effects. What is wrong with the plot?
b. Instead of using geom_qq() and geom_qq_line(), construct a normal quantile plot using geom_point () and add an appropriate straight line to the plot that connects the first and third quantiles of the theoretical and sample distributions.
c. Suppose the absolute values of factorial effects are used in a normal quantile plot. Will the result be an interpretable plot to assess the significance of factorial effects in an unreplicated design? Explain.
Data from Section 6.5 .2
......................
Data from Figure 6.7
Step by Step Answer:

This question has not been answered yet.
You can Ask your question!

Design And Analysis Of Experiments And Observational Studies Using R
ISBN: 9780367456856
1st Edition
Authors: Nathan Taback
