

Refer to Exercise 2.27 and the data on state SAT scores. Construct a scatterplot for the data,
Question:
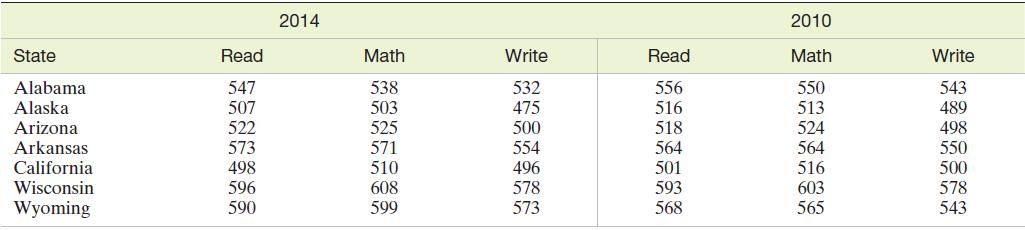
Refer to Exercise 2.27 and the data on state SAT scores. Construct a scatterplot for the data, with 2010 Math SAT score on the horizontal axis and 2014 Math SAT score on the vertical axis. What type of trend do you detect?
Data from Exercise 2.27
Educators are constantly evaluating the efficacy of public schools in the education and training of American students. One quantitative assessment of change over time is the difference in scores on the SAT, which has been used for decades by colleges and universities as one criterion for admission. Originally, the SAT provided scores in reading and mathematics. Now, three scores are provided: reading, mathematics, and critical writing. SAT scores for each of the 50 states and District of Columbia for the years 2014 and 2010 are saved in the accompanying file. Data for the first five and last two states are shown in the table.
Step by Step Answer:


Statistics For Business And Economics
ISBN: 9781292227085
13th Global Edition
Authors: Terry Sincich James Mcclave, P. George Benson
