

The Energy Information Administration of the U.S. Department of Energy provided time series data for the U.S.
Question:
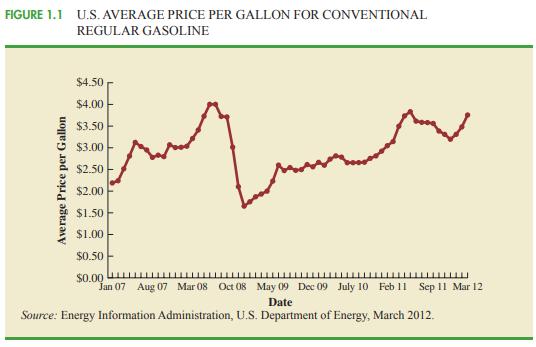
The Energy Information Administration of the U.S. Department of Energy provided time series data for the U.S. average price per gallon of conventional regular gasoline between January 2007 and March 2012 (Energy Information Administration website, April 2012).
Use the Internet to obtain the average price per gallon of conventional regular gasoline since March 2012.
a. Extend the graph of the time series shown in Figure 1.1.
b. What interpretations can you make about the average price per gallon of conventional regular gasoline since March 2012?
c. Does the time series continue to show a summer increase in the average price per gallon?
Explain.
Step by Step Answer:

This question has not been answered yet.
You can Ask your question!


Statistics For Business And Economics
ISBN: 9781305446076
12th Edition
Authors: David R Anderson , Dennis J Sweeney , Thomas A Williams , Jeffrey D Camm
