

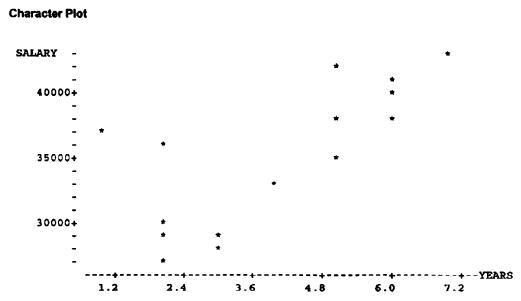
The figure below is a plot of salary and experience of employees of the Endicott Company. Answer
Question:
The figure below is a plot of salary and experience of employees of the Endicott Company. Answer the following questions by using a Venn diagram.
(a) The probability of experience between 3 and 5 years
(b) The probability of more than 4 years’ experience and a salary of between $25,000 and $37,000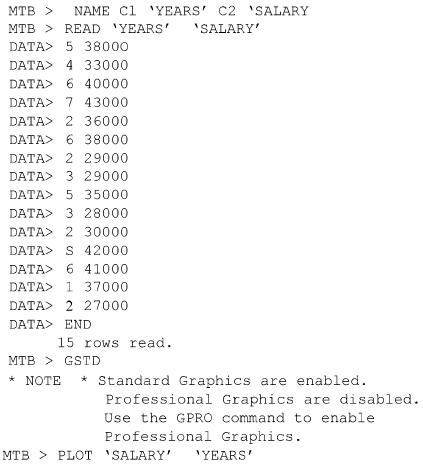
Fantastic news! We've Found the answer you've been seeking!
Step by Step Answer:
To answer the questions provided well need to use the data from the table provided as a Venn diagram ...View the full answer

Answered By
Sandip Nandnawar
I am a B.E (Information technology) from GECA and also have an M.C.M from The University of RTMNU, MH.
I worked as a software developer (Programmer and TL). Also working as an expert for the last 6 years and deal with complex assessment and projects. I have a team and lead a team of experts and conducted primary and secondary research. I am a senior software engg and senior expert and deal with all types of CSE and IT and other IT-related assessments and projects and homework.
1+ Reviews
10+ Question Solved
Related Book For 

Statistics For Business And Financial Economics
ISBN: 9781461458975
3rd Edition
Authors: Cheng Few Lee , John C Lee , Alice C Lee
Question Posted:
