

The following MINITAB output exhibits the cumulative distribution function curves of three lognormal distributions. Their mean and
Question:
The following MINITAB output exhibits the cumulative distribution function curves of three lognormal distributions. Their mean and variance, respectively, are (1, .5), (1, 1), and (1, 2). Compare the three cumulative distribution curves indicated in the figure.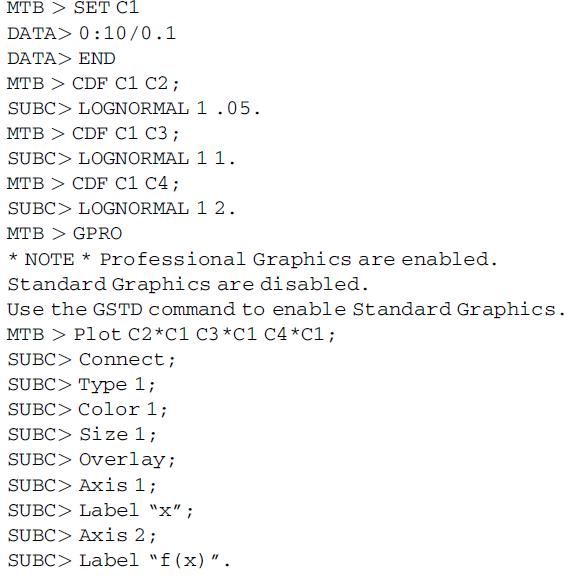
Fantastic news! We've Found the answer you've been seeking!
Step by Step Answer:
The MINITAB output you provided exhibits the cumulative distribution function CDF curves for three different lognormal distributions each having the same mean value of 1 but different variances of 05 ...View the full answer

Answered By
Krishnavendra Y
I am a self motivated financial professional knowledgeable in; preparation of financial reports, reconciling and managing accounts, maintaining cash flows, budgets, among other financial reports. I possess strong analytical skills with high attention to detail and accuracy. I am able to act quickly and effectively when dealing with challenging situations. I have the ability to form positive relationships with colleagues and I believe that team work is great key to performance. I always deliver quality, detailed, original (0% plagiarism), well-researched and critically analyzed papers.
4+ Reviews
10+ Question Solved
Related Book For 

Statistics For Business And Financial Economics
ISBN: 9781461458975
3rd Edition
Authors: Cheng Few Lee , John C Lee , Alice C Lee
Question Posted:
