

The following table, reprinted from the November 20, 1991, Wall Street Journal, shows the percentage change of
Question:
The following table, reprinted from the November 20, 1991, Wall Street Journal, shows the percentage change of stock prices for ten Dow Jones sectors over two different periods.
(a) Calculate the arithmetic mean and geometric mean of the two sets of data.
(b) Calculate the standard deviation and mean absolute deviation of these two sets of data.
(c) Calculate the Z scores and do related analysis.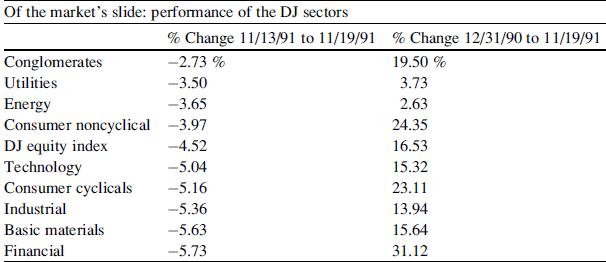
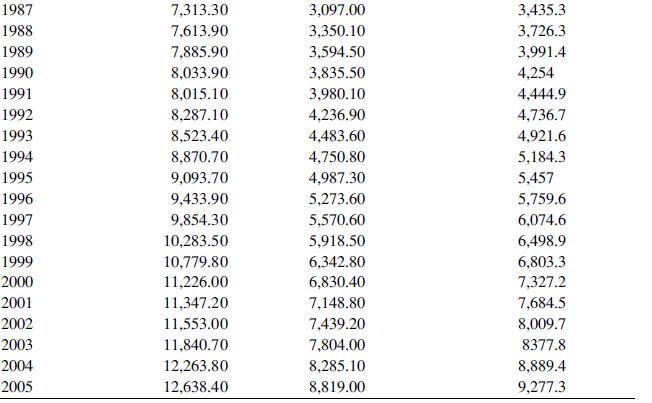
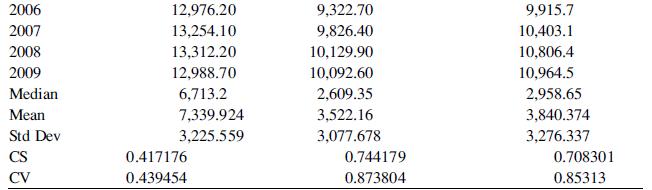
Refer to Table 4.17, in which the GDP, personal consumption, and disposable income during the period 1960–2009 are given.
Table 4.17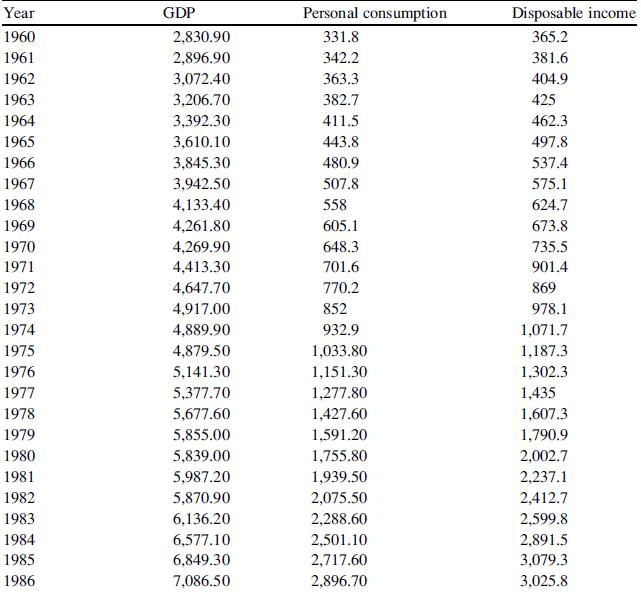
Fantastic news! We've Found the answer you've been seeking!
Step by Step Answer:
To answer your question Ill first explain each of the parts a b and c and then well execute the calculations using the data provided in Table 417 for the changes in stock prices for ten Dow Jones sect...View the full answer

Answered By
Hamza Amjad
Currently I am student in master degree program.from last two year I am tutring in Academy and I tought many O/A level student in home tution.
3+ Reviews
10+ Question Solved
Related Book For 

Statistics For Business And Financial Economics
ISBN: 9781461458975
3rd Edition
Authors: Cheng Few Lee , John C Lee , Alice C Lee
Question Posted:
