

The table below shows the undergraduate GPA and quantitative scores on the GRE of 10 students. Explain
Question:
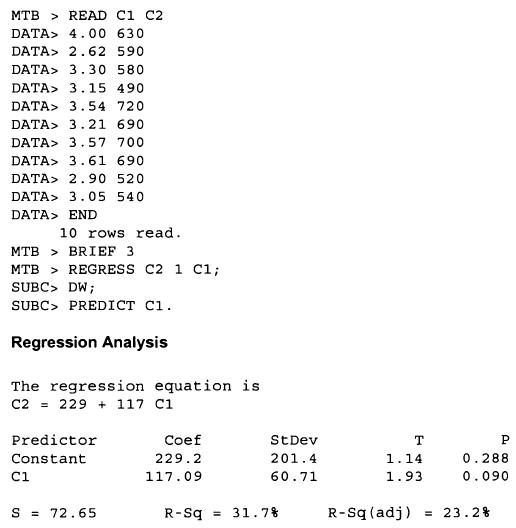
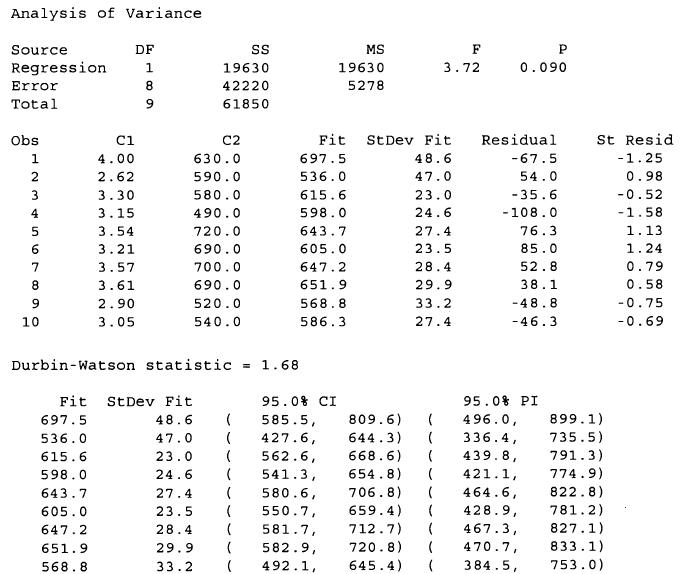
The table below shows the undergraduate GPA and quantitative scores on the GRE of 10 students. Explain the MINITAB output shown below.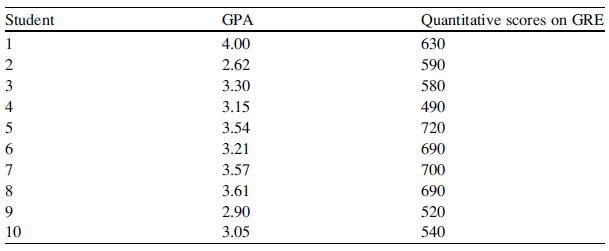
![]()
Fantastic news! We've Found the answer you've been seeking!
Step by Step Answer:

Answered By
Arti Sharma
teaching at home for 5 years up to 10th standard.
0 Reviews
10+ Question Solved
Related Book For 

Statistics For Business And Financial Economics
ISBN: 9781461458975
3rd Edition
Authors: Cheng Few Lee , John C Lee , Alice C Lee
Question Posted:
