

Use a bar graph to plot the frequency distribution. Use the goaltenders salaries for the 1991 NHL
Question:
Use a bar graph to plot the frequency distribution.
Use the goaltenders’ salaries for the 1991 NHL season given in the following table to answer question.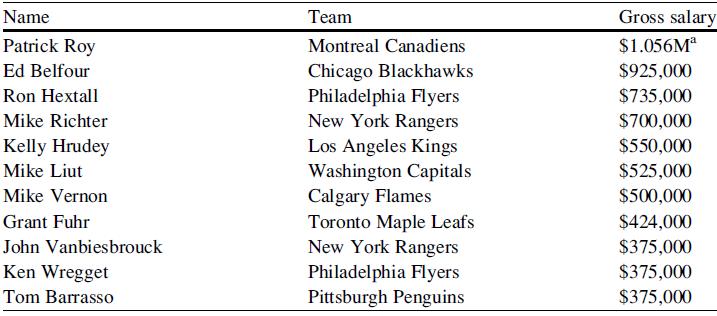
Step by Step Answer:

This question has not been answered yet.
You can Ask your question!
Related Book For 

Statistics For Business And Financial Economics
ISBN: 9781461458975
3rd Edition
Authors: Cheng Few Lee , John C Lee , Alice C Lee
Question Posted:
