

Use a pie chart to show how Phoenixs total team defense is divided between rush and pass.
Question:
Use a pie chart to show how Phoenix’s total team defense is divided between rush and pass.
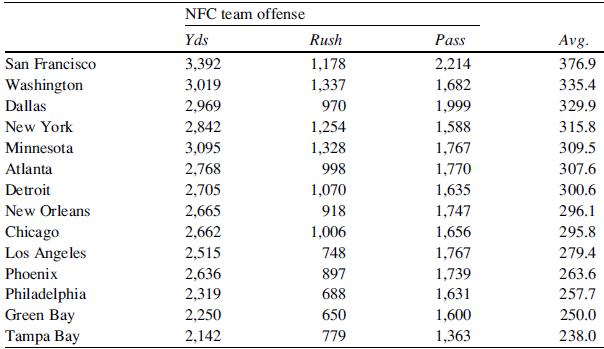
To answer question, refer to the table, which gives the rankings for team defense and offense for NFC teams for the first 9 weeks of the 1991 season.
Rankings of team defense and offense for NFC teams in the 1991 season.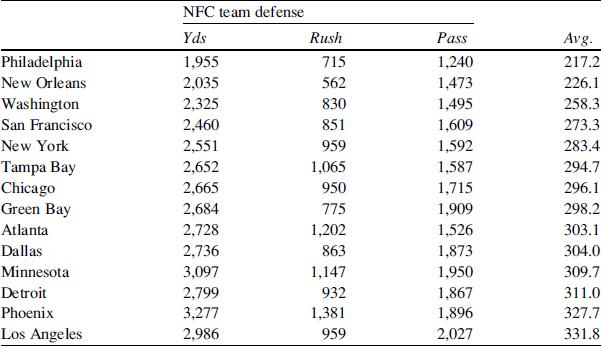
Fantastic news! We've Found the answer you've been seeking!
Step by Step Answer:

Answered By
Sonam Kumari
As a tutor, i am new in this field. But, earlier i have worked on different platforms where i helped different students in doing their assignments on the subject i am having a good command. Still i am in my learning phase and trying to learn daily new thing. I have worked on chegg, course hero platform earlier.
0 Reviews
10+ Question Solved
Related Book For 

Statistics For Business And Financial Economics
ISBN: 9781461458975
3rd Edition
Authors: Cheng Few Lee , John C Lee , Alice C Lee
Question Posted:
