

Use the data given in question 31 to forecast Johnson & Johnsons inventory turnover for 1989 and
Question:
Use the data given in question 31 to forecast Johnson & Johnson’s inventory turnover for 1989 and 1990. Construct a 95 % confidence interval for both of these forecasts. Use Eq. 14.21.
Eq. 14.21![]()
Question 31
When we are interested in the relationship between a dependent variable and time, we sometimes use a time-trend regression. That is, we use a dependent variable that consists only of the day, month, or year of our observations. A time-trend regression is given by the equation![]()
where t represents time, t = 1,2,3, . . ., T. Suppose we are interested in how Johnson & Johnson’s inventory turnover has changed over time. We collect data on J&J’s inventory turnover for a 20-year period from 1969 to 1988. Use the MINITAB program to answer the following:
(a) Draw a scatter diagram for these data.
(b) Estimate the regression coefficients α and β.
(c) Calculate SSR, SSE, SST, and R2, and the standard error of the estimate.
(d) Compute the standard error of
b, and use a t-test to test the significance of b.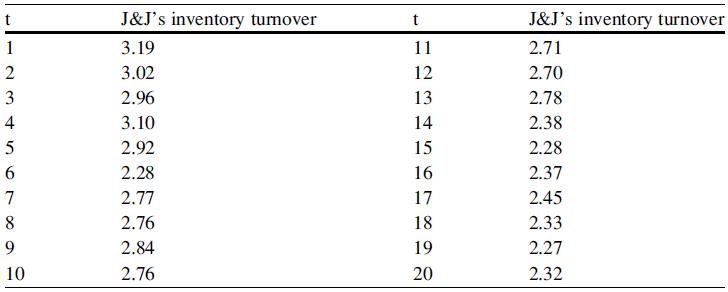
Step by Step Answer:

This question has not been answered yet.
You can Ask your question!


Statistics For Business And Financial Economics
ISBN: 9781461458975
3rd Edition
Authors: Cheng Few Lee , John C Lee , Alice C Lee
