

Refer to the U.S. Army Corps of Engineers data on contaminated fish, Exercise 11.26. You fit the
Question:
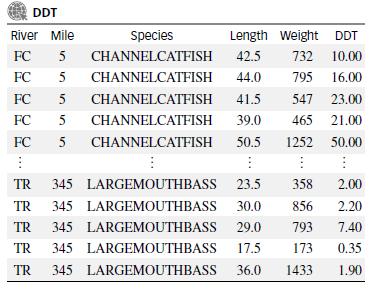
Refer to the U.S. Army Corps of Engineers data on contaminated fish, Exercise 11.26. You fit the first-order model relating DDT level (y) to miles upstream (x1), fish length (x2), and fish weight (x3).
a. Propose a model for E(y) that hypothesizes that the rate of increase of DDT level with length is greater for heavier contaminated fish.
b. Fit the model, part a, to the data. Give the least-squares prediction equation.
c. Test the theory, part a, using α = .10. What do you conclude?
Data from Exercise 11.26
Refer to the U.S. Army Corps of Engineers data on fish contaminated from the toxic discharges of a chemical plant located on the banks of the Tennessee River in Alabama. Recall that the engineers measured the length (in centimeters), weight (in grams), and DDT level (in parts per million) for 144 captured fish. In addition, the number of miles upstream from the river was recorded. The data are saved in the DDT file.
Step by Step Answer:
Answer a To propose a model for Ey that hypothesizes that the rate of increase of DDT level with length is greater for heavier contaminated fish we ca...View the full answer


Statistics For Engineering And The Sciences
ISBN: 9781498728850
6th Edition
Authors: William M. Mendenhall, Terry L. Sincich
