

Consider the following data set: a. Construct a normal probability plot for these data. Do the data
Question:
Consider the following data set:
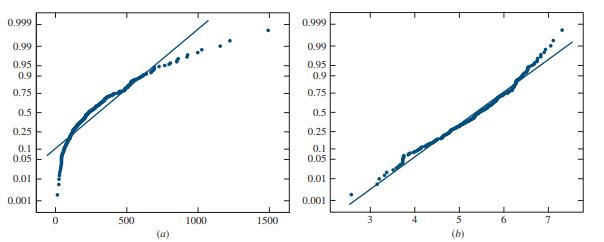
a. Construct a normal probability plot for these data. Do the data appear to come from an approximately normal distribution?
b. Transform the data by taking the square root of each value in the data set. Show that the square roots appear to come from an approximately normal distribution.
Figure 4.23 shows that nonnormal data can sometimes be made approximately normal by applying an appropriate function (in this case the natural logarithm). This is known as transforming the data. Exercises 9 and 10 present examples of other transformations.
Figure 4.23:
Step by Step Answer:

This question has not been answered yet.
You can Ask your question!
Related Book For 

Question Posted:
