

Repeat Exercise 8, using the (S) chart in place of the (R) chart. Data From Exercise 8:
Question:
Repeat Exercise 8, using the \(S\) chart in place of the \(R\) chart.
Data From Exercise 8:
Samples of eight bolts are taken periodically, and their diameters (in \(\mathrm{mm}\) ) are measured. The following table presents the means, ranges, and standard deviations for 25 consecutive samples.
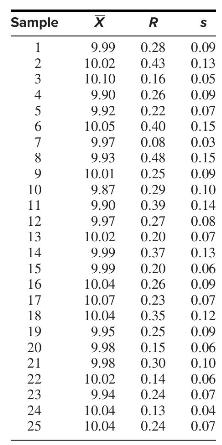
The means are \(\overline{\bar{X}}=9.9892, \bar{R}=0.2628\), and \(\bar{s}=\) 0.0880 .
Fantastic news! We've Found the answer you've been seeking!
Step by Step Answer:

Answered By
Geoffrey Isaboke
I am an industrious tutor with a 5-yr experience in professional academic writing. I have passion for History and Music and I have good knowledge in Economics
2+ Reviews
10+ Question Solved
Related Book For 
Question Posted:
