

A national survey asked people, How often do you have dinner outside instead of at home? The
Question:
A national survey asked people, “How often do you have dinner outside instead of at home?” The frequencies were as follows.
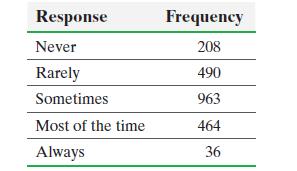
(a) Construct a relative frequency distribution.
(b) What percentage of respondents answered “Always”?
(c) What percentage of respondents answered “Never” or “Rarely”?
(d) Construct a frequency bar graph.
(e) Construct a relative frequency bar graph.
(f) Construct a pie chart.
(g) Suppose a person claims that, “1.7% of all people in the nation always eat out.” Is this a descriptive or inferential statement?
Step by Step Answer:

This question has not been answered yet.
You can Ask your question!
Related Book For 

Statistics Informed Decisions Using Data
ISBN: 9781292157115
5th Global Edition
Authors: Michael Sullivan
Question Posted:
