

Draw a normal probability plot of the data in Table 4 using technology. Is there evidence to
Question:
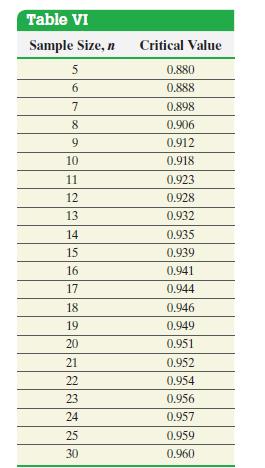
Draw a normal probability plot of the data in Table 4 using technology. Is there evidence to support the belief that the variable “finishing time” is normally distributed?
Approach We will use StatCrunch to draw the normal probability plot and find the correlation between the observed values and expected z-scores. If the correlation is greater than the critical value from Table VI, we conclude the data could come from a population that is normally distributed. The steps for constructing normal probability plots using TI-83/84 Plus graphing calculators, Minitab, Excel, and StatCrunch can be found.
Fantastic news! We've Found the answer you've been seeking!
Step by Step Answer:
Figure 34 shows the normal probability plot The correlation between the observ...View the full answer

Answered By
Diane Joyce Pastorin
Please accept my enthusiastic application to solutioninn. I would love the opportunity to be a hardworking, passionate member of your tutoring program. As soon as I read the description of the program, I knew I was a well-qualified candidate for the position.
I have extensive tutoring experience in a variety of fields. I have tutored in English as well as Calculus. I have helped students learn to analyze literature, write essays, understand historical events, and graph parabolas. Your program requires that tutors be able to assist students in multiple subjects, and my experience would allow me to do just that.
You also state in your job posting that you require tutors that can work with students of all ages. As a summer camp counselor, I have experience working with preschool and kindergarten-age students. I have also tutored middle school students in reading, as well as college and high school students. Through these tutoring and counseling positions, I have learned how to best teach each age group.
2+ Reviews
10+ Question Solved
Related Book For 

Statistics Informed Decisions Using Data
ISBN: 9781292157115
5th Global Edition
Authors: Michael Sullivan
Question Posted:
