

In fiscal year (FY) 2013-2014 (July 2013-June 2014), the Florida Lottery generated ($ 5.37) billion in total
Question:
In fiscal year (FY) 2013-2014 (July 2013-June 2014), the Florida Lottery generated \(\$ 5.37\) billion in total sales. Over that period, the state spent \(\$ 37.5\) million on advertising to promote its various games. Rand Advertising is interested in gaining access to this lucrative market. You are assigned the task of preparing a report on the lottery sales structure for three of Florida's online (nonscratch-off ticket) games: Fantasy 5, Lucky Money, and Lotto. Your findings will become part of a proposal by Rand to the Florida Lottery.
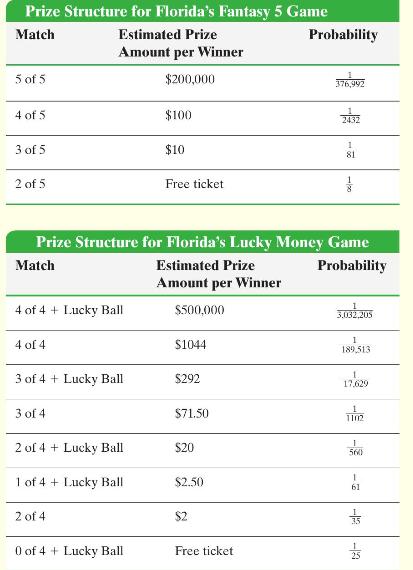
In Fantasy 5, a player picks five numbers from 1 to 36 , at \(\$ 1\) per play. Drawings are held seven days a week. If there is no jackpot winner for a drawing, the money allocated for the top prize rolls down to the next prize tier (4 of 5).
The Lucky Money game costs \(\$ 1\) per ticket. Players pick four numbers from 1 to 47 and one Lucky Money number from 1 to 22. Drawings are held on Tuesdays and Fridays. If there is no jackpot winner for a drawing, the money allocated for the top prize rolls over to the next drawing, adding to the total of the next jackpot. The prize structures for both games is as shown.
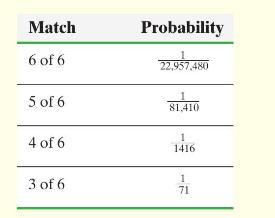
In Lotto, players pick six numbers from 1 to 53 , at \(\$ 1\) per play. Drawings are held on Wednesdays and Saturdays. If there is no jackpot winner, the top prize is rolled over to the next drawing. It is difficult to win the Lotto jackpot, so there are numerous jackpot rollovers. Rollovers make it difficult to determine an estimated prize payout per winner. However, the odds structure is shown in the table at the top of the next column.
To conduct your study, you have obtained the sales figures for each of the three games by district sales office for one week. These data are as follows:
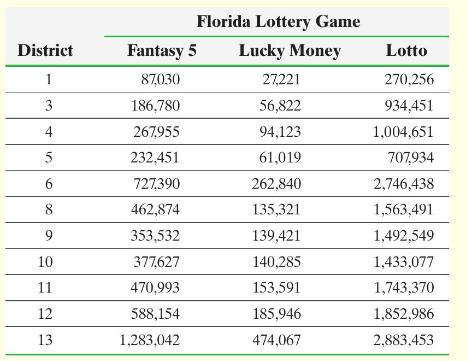
Are the numbers of tickets sold for each lottery game and sales district independent? Construct a bar graph that represents the conditional distribution of game by sales district. Does this graphical evidence support your conclusion regarding the relationship between the type of game and the sales district? Explain.
Additionally, you are interested in the daily sales structure for the various districts. The following are the numbers of tickets sold each day for a randomly selected week for the three games in District 1.
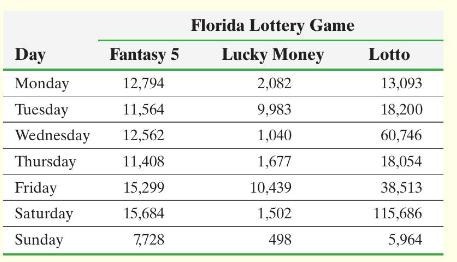
Does the evidence suggest that the proportion of Fantasy 5 sales is the same for each day of the week? Perform a similar test for Lucky Money and Lotto.
Write a report detailing your assumptions, analyses, findings, and conclusions.
Step by Step Answer:

This question has not been answered yet.
You can Ask your question!


Statistics Informed Decisions Using Data
ISBN: 9781292157115
5th Global Edition
Authors: Michael Sullivan
