

In the Spacelab Life Sciences 2, led by Paul X. Callahan, 14 male rats were sent to
Question:
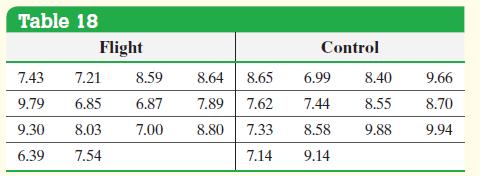
In the Spacelab Life Sciences 2, led by Paul X. Callahan, 14 male rats were sent to space. The red blood cell mass (in milliliters) of the rats was determined when they returned. A control group of 14 male rats was held under the same conditions (except for space flight) as the space rats, and their red blood cell mass was also measured when the space rats returned. The data are in Table 18. Construct side-byside boxplots for red blood cell mass for the flight group and control group. Does it appear that space flight affected the rats’ red blood cell mass?
Approach Comparing two data sets is easy if we draw side-by-side boxplots on the same horizontal number line. Graphing calculators with advanced statistical features, as well as statistical spreadsheets such as Minitab, Excel, and StatCrunch, can draw boxplots. We will use StatCrunch to draw the boxplots. The steps for drawing boxplots using a TI-83/84 Plus graphing calculator, Minitab, Excel, and StatCrunch are given in the Technology Step-by-Step.
Step by Step Answer:
Figure 23 shows the sidebyside boxplots drawn in StatCrunch It ap...View the full answer


Statistics Informed Decisions Using Data
ISBN: 9781292157115
5th Global Edition
Authors: Michael Sullivan
