

Suppose you are considering investing in a Roth IRA. You collect the data in Table 12, which
Question:
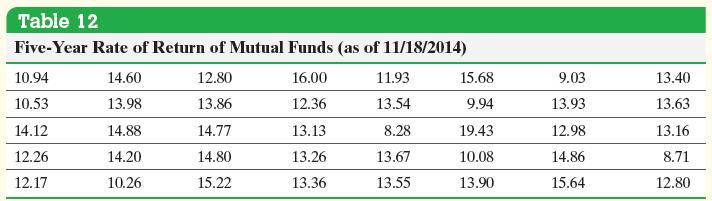
Suppose you are considering investing in a Roth IRA. You collect the data in Table 12, which represent the five-year rate of return (in percent, adjusted for sales charges) for a simple random sample of 40 large-blended mutual funds. Construct a frequency and relative frequency distribution of the data.
Approach To construct a frequency distribution, first create classes of equal width.
Table 12 has 40 observations that range from 8.28 to 19.43, so we decide to create the classes such that the lower class limit of the first class is 8 (a little smaller than the smallest data value) and the class width is 1. There is nothing magical about the choice of 1 as a class width. We could have selected a class width of 3 or any other class width. We choose a class width that we think will nicely summarize the data. If our choice doesn’t accomplish this, we can always try another. The second class has a lower class limit 8 + 1 = 9. The classes cannot overlap, so the upper class limit of the first class is 8.99. Continuing in this fashion, we obtain the following classes:
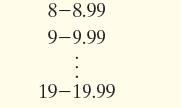
This gives us 12 classes. Tally the number of observations in each class, count the tallies, and create the frequency distribution. Divide the frequency of each class by 40, the number of observations, to obtain the relative frequency.
Step by Step Answer:
Tally the data as shown in the second column of Table 13 T...View the full answer


Statistics Informed Decisions Using Data
ISBN: 9781292157115
5th Global Edition
Authors: Michael Sullivan
