

The data in Table 1.20 show statistics on the age distribution of Chinese victims of COVID-19. (These
Question:
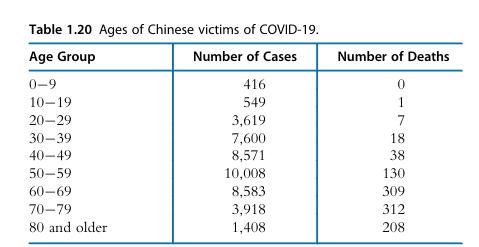
The data in Table 1.20 show statistics on the age distribution of Chinese victims of COVID-19. (These data, from China CDC Weekly, are dated February 11, 2020, when the pandemic was well underway in China.)
(a) Produce relative frequency histograms for the ages of the cases and deaths.
To handle the open-ended “80+” class, use a bar whose base is the same width as for the other classes, but use a “break mark,” such as //, to draw the reader’s attention to its different scale.
(b) Compare the differences in the distributions for the cases and deaths. What is the most remarkable difference?
(c) Compute the death rate per 1000 cases (# deaths1000/# cases) for each age group. Plot the death rates versus the midpoint of each age class (use 85 for the last class). Write a short sentence describing the relationship.
Step by Step Answer:


Statistical Methods
ISBN: 9780128230435
4th Edition
Authors: Donna L. Mohr, William J. Wilson, Rudolf J. Freund
