

The data in Table 2 represent the monthly rates of return of the Standard and Poor's Index
Question:
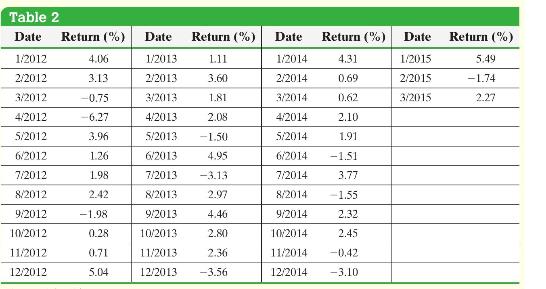
The data in Table 2 represent the monthly rates of return of the Standard and Poor's Index of 500 Stocks from January 2012 through March 2015. Test the randomness of positive monthly rates of return at the \(\alpha=0.05\) level of significance.
Approach Let \(P\) represent a positive monthly rate of return and \(N\) represent a negative or zero monthly rate of return. We list the sequence of \(P \mathrm{~s}\) and \(N \mathrm{~s}\) in chronological order and determine \(n\) (the sample size), \(n_{1}\) (the number of \(P \mathrm{~s}\) ), \(n_{2}\) (the number of \(N \mathrm{~s}\) ), and \(r\) (the number of runs). We then verify that the requirements are satisfied and follow Steps 1 through 5.
Step by Step Answer:


Statistics Informed Decisions Using Data
ISBN: 9781292157115
5th Global Edition
Authors: Michael Sullivan
