

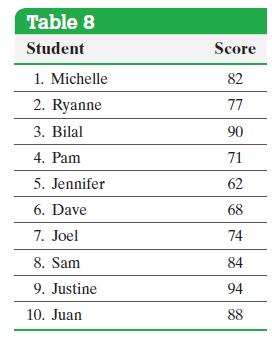
The data in Table 8 represent the scores on the first exam of 10 students enrolled in
Question:
The data in Table 8 represent the scores on the first exam of 10 students enrolled in Introductory Statistics. Compute the range.
Approach The range is the difference between the largest and smallest data values.
Fantastic news! We've Found the answer you've been seeking!
Step by Step Answer:
The highest test score is 94 and the lowes...View the full answer

Answered By
Joan Gakii
I'm a meticulous professional writer with over five years writing experience. My skill set includes
- Digital Content,
- Interpersonal Communication,
- Web Content and academic Writing,
- Proofreading,
- Editing,
- Project Management, and
- Public Relations.
7+ Reviews
12+ Question Solved
Related Book For 

Statistics Informed Decisions Using Data
ISBN: 9781292157115
5th Global Edition
Authors: Michael Sullivan
Question Posted:
