

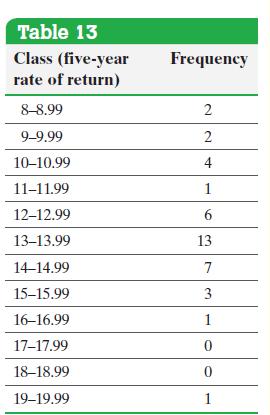
The frequency distribution in Table 13 represents the five-year rate of return of a random sample of
Question:
The frequency distribution in Table 13 represents the five-year rate of return of a random sample of 40 large-blended mutual funds. Approximate the mean fiveyear rate of return.
Approach
Step 1 Determine the class midpoint of each class by adding consecutive lower class limits and dividing the result by 2.
Step 2 Compute the sum of the frequencies, ∑fi.
Step 3 Multiply the class midpoint by the frequency to obtain xi fi for each class.
Step 4 Compute ∑xi fi.
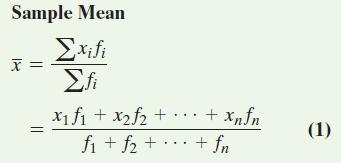
Step 5 Substitute into Sample Mean Formula (1) to obtain the mean from grouped data.
Sample Mean Formula 1
Fantastic news! We've Found the answer you've been seeking!
Step by Step Answer:

Answered By
Shaira grace
I have experience of more than ten years in handing academic tasks and assisting students to handle academic challenges. My level of education and expertise allows me communicate eloquently with clients and therefore understanding their nature and solving it successfully.
4+ Reviews
10+ Question Solved
Related Book For 

Statistics Informed Decisions Using Data
ISBN: 9781292157115
5th Global Edition
Authors: Michael Sullivan
Question Posted:
