

The Partisan Conflict Index (PCI) tracks the degree of political disagreement among U.S. politicians in the federal
Question:
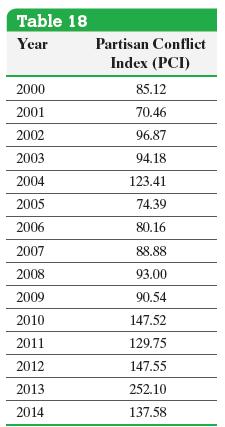
The Partisan Conflict Index (PCI) tracks the degree of political disagreement among U.S. politicians in the federal government. It is found by measuring the frequency of newspaper articles reporting disagreement in a given month. Higher values of the index suggest greater conflict among political parties, Congress, and the President. The data in Table 18 represents the PCI in October from 2000 to 2014.
Construct a time-series plot of the data. In what year was the index highest?
Approach
Step 1 Plot points for each year, with the date on the horizontal axis and the Partisan Conflict Index on the vertical axis.
Step 2 Connect the points with line segments.
Fantastic news! We've Found the answer you've been seeking!
Step by Step Answer:
Figure 19 shows the timeseries plot Notice the jump in the PCI fol...View the full answer

Answered By
Mamba Dedan
I am a computer scientist specializing in database management, OS, networking, and software development. I have a knack for database work, Operating systems, networking, and programming, I can give you the best solution on this without any hesitation. I have a knack in software development with key skills in UML diagrams, storyboarding, code development, software testing and implementation on several platforms.
49+ Reviews
119+ Question Solved
Related Book For 

Statistics Informed Decisions Using Data
ISBN: 9781292157115
5th Global Edition
Authors: Michael Sullivan
Question Posted:
