

Use the data in Table 4. (a) Find the least-squares regression equation (hat{y}=b_{0}+b_{1} x_{1}+b_{2} x_{2}), where (x_{1})
Question:
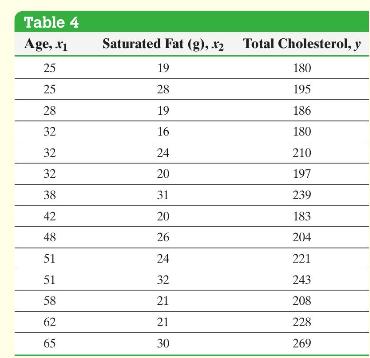
Use the data in Table 4.
(a) Find the least-squares regression equation \(\hat{y}=b_{0}+b_{1} x_{1}+b_{2} x_{2}\), where \(x_{1}\) represents the patient's age, \(x_{2}\) represents the patient's daily consumption of saturated fat, and \(y\) represents the patient's total cholesterol.
(b) Draw residual plots and a boxplot of the residuals to assess the adequacy of the model.
Approach Enter the data into Minitab to obtain the least-squares regression equation and to draw the residual plots and boxplot of the residuals. The steps for determining the multiple regression equation and residual plots using Minitab, Excel, and StatCrunch are given in the Technology Step-by-Step.
Step by Step Answer:
a Figure 15 shows the output from Minitab The leastsquares regression equation for these ...View the full answer


Statistics Informed Decisions Using Data
ISBN: 9781292157115
5th Global Edition
Authors: Michael Sullivan
