

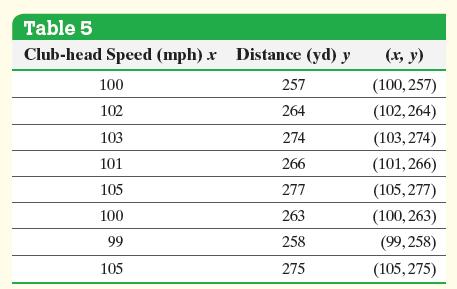
Use the golf data in Table 5. (a) Find the least-squares regression line. (b) Draw the least-squares
Question:
Use the golf data in Table 5.
(a) Find the least-squares regression line.
(b) Draw the least-squares regression line on the scatter diagram of the data.
(c) Predict the distance a golf ball will travel when hit with a club-head speed of 103 miles per hour (mph).
(d) Determine the residual for the predicted value found in part (c). Is the distance in Table 5 above average or below average among all balls hit with a swing speed of 103 mph?
Approach Because technology plays a role in obtaining the least-squares regression line, we will use a TI-84 Plus C graphing calculator, Minitab, Excel, and StatCrunch to obtain the least-squares regression line. The steps for obtaining regression lines are given in the Technology Step-by-Step.
Step by Step Answer:


Statistics Informed Decisions Using Data
ISBN: 9781292157115
5th Global Edition
Authors: Michael Sullivan
