

The following frequency distribution represents the closing prices (in dollars) of homes sold in a Midwest city.
Question:
The following frequency distribution represents the closing prices (in dollars) of homes sold in a Midwest city.
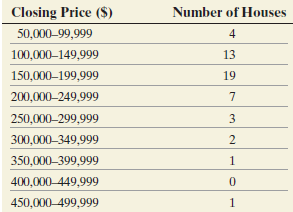
(a) Construct a cumulative frequency distribution.
(b) Construct a cumulative relative frequency distribution.
(c) What percent of homes sold for less than $200,000?
(d) Construct a frequency polygon. Describe the shape of the distribution.
(e) Construct a frequency ogive.
(f) Construct a relative frequency ogive.
DistributionThe word "distribution" has several meanings in the financial world, most of them pertaining to the payment of assets from a fund, account, or individual security to an investor or beneficiary. Retirement account distributions are among the most...
Fantastic news! We've Found the answer you've been seeking!
Step by Step Answer:
a b c The cumulative relative frequency for the class 150000199000 is ...View the full answer

Answered By
Utsab mitra
I have the expertise to deliver these subjects to college and higher-level students. The services would involve only solving assignments, homework help, and others.
I have experience in delivering these subjects for the last 6 years on a freelancing basis in different companies around the globe. I am CMA certified and CGMA UK. I have professional experience of 18 years in the industry involved in the manufacturing company and IT implementation experience of over 12 years.
I have delivered this help to students effortlessly, which is essential to give the students a good grade in their studies.
2+ Reviews
10+ Question Solved
Related Book For 

Statistics Informed Decisions Using Data
ISBN: 9780321757272
4th Edition
Authors: Michael Sullivan III
Question Posted:
