

Create a scatterplot for the last two variables in Table 3.1 (i.e., Sibling understands me and Language
Question:
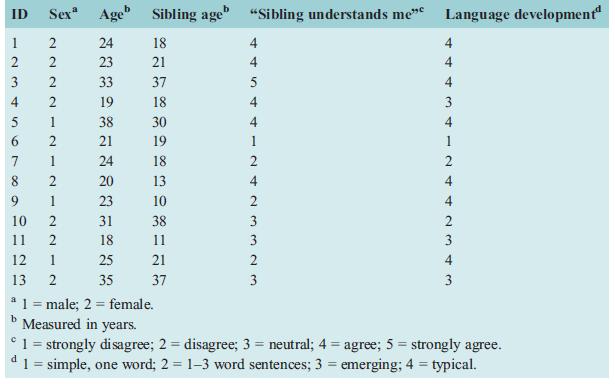
Create a scatterplot for the last two variables in Table 3.1 (i.e., “Sibling understands me” and “Language development”). Note that some subjects’ dots will be on top of each other in this scatterplot.
a. What does this scatterplot tell you about your subjects?
b. What does this scatterplot tell you about the two variables in the dataset?
Table 3.1
Fantastic news! We've Found the answer you've been seeking!
Step by Step Answer:
To create a scatterplot for the variables Sibling understands me and Language development from Table 31 you would typically use a statistical software ...View the full answer

Answered By
Rishi rajn Sinha
An outstanding classroom practitioner who has passion for education and who has possesses a proven track record of leading students to high academic achievement .I am committed to give my best .I am responsible for teaching ,engaging, rigorous as well as relevant lessons that will give the schools students a comprehensive education. Preparing pupils for examination.
0 Reviews
10+ Question Solved
Related Book For 
Statistics For The Social Sciences A General Linear Model Approach
ISBN: 9781107576971
1st Edition
Authors: Russell T. Warne
Question Posted:
