

In Figure 3.2, why do the intervals span from 0.5 to 1.5, from 1.5 to 2.5, etc.,
Question:
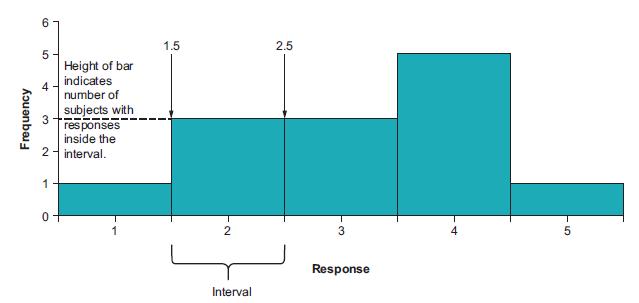
In Figure 3.2, why do the intervals span from 0.5 to 1.5, from 1.5 to 2.5, etc., when all of the numbers in the dataset are whole numbers?
Figure 3.2
Fantastic news! We've Found the answer you've been seeking!
Step by Step Answer:
ANSWER The intervals in a frequency distribution table are determined b...View the full answer

Answered By
Adrian Kenneth De Vera
I've a lot of experience in different fields specifically in accounting, . mathematical analysis and creating poems besides other personal experiences.
0 Reviews
10+ Question Solved
Related Book For 
Statistics For The Social Sciences A General Linear Model Approach
ISBN: 9781107576971
1st Edition
Authors: Russell T. Warne
Question Posted:
