

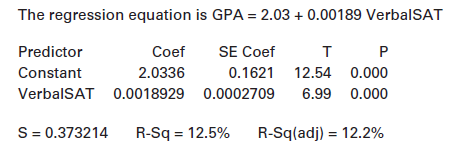
A scatterplot with regression line is shown in Figure 9.7 for a regression model using Verbal SAT
Question:
Figure 9.7
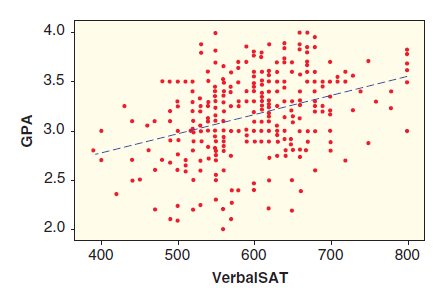
(a) Use the scatterplot to determine whether we should have any significant concerns about the conditions being met for using a linear model with these data.
(b) Use the fitted model to predict the GPA of a person with a score on the Verbal SAT exam of 650.
(c) What is the estimated slope in this regression model? Interpret the slope in context.
(d) What is the test statistic for a test of the slope? What is the p-value? What is the conclusion of the test, in context?
(e) What is R2? Interpret it in context.
Fantastic news! We've Found the answer you've been seeking!
Step by Step Answer:
a On the scatterplot we have concerns if there is a curved pattern there isnt or variability from th...View the full answer

Answered By
Kennedy Odhiambo
As a professional writer, I have been in the field for over 5 years having worked as a lecture in different tertiary institutions across the world. With this impeccable experience, I assure provision of a good and supporting environment for students to learn.
2+ Reviews
10+ Question Solved
Related Book For 

Statistics Unlocking The Power Of Data
ISBN: 9780470601877
1st Edition
Authors: Robin H. Lock, Patti Frazer Lock, Kari Lock Morgan, Eric F. Lock, Dennis F. Lock
Question Posted:
