

Figure A.10 shows a histogram of the systolic blood pressure (in mm Hg) for all 200 patients
Question:
Figure A.10
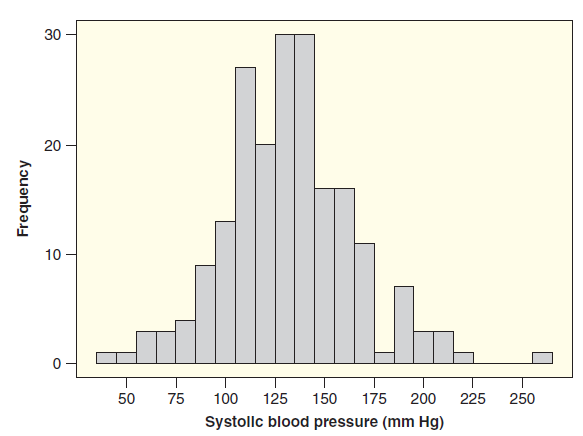 (a) Is it appropriate to use the 95% rule with these data? Why or why not?
(b) Use the 95% rule to give an interval that is likely to contain about 95% of the data values.
(c) Use the data in the ICUAdmissions dataset to count the actual number of data values, and find the percent of data values, lying within the interval given in part (b).
(d) Is the result for the sample close to the result predicted by the 95% rule?
Fantastic news! We've Found the answer you've been seeking!
Step by Step Answer:
a Yes it is appropriate to use the 95 rule since we see in the histogram of blood pressures tha...View the full answer

Answered By
Kumar Hrishav
I have been working as part time teacher since I completed my graduation. I feel good to be able to help out students because I'm passionate about teaching. My motto for teaching is to convey the knowledge I have to students in a way that makes them understanding it easily.
0 Reviews
10+ Question Solved
Related Book For 

Statistics Unlocking The Power Of Data
ISBN: 9780470601877
1st Edition
Authors: Robin H. Lock, Patti Frazer Lock, Kari Lock Morgan, Eric F. Lock, Dennis F. Lock
Question Posted:
