

The data for the 10,000 simulated dogowner matches shown in Figure 4.7 on page 237 are given
Question:
Figure 4.7
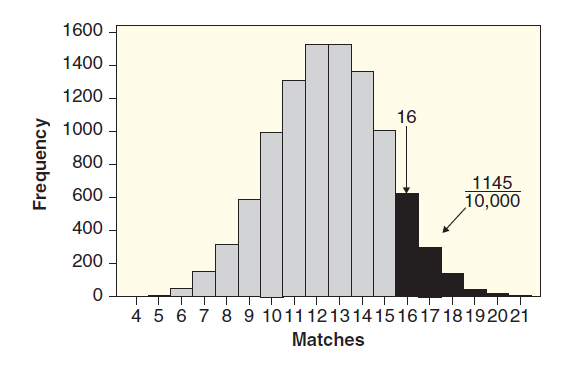
Table 4.6
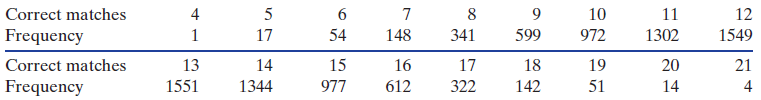
(a) Use the data in the table to verify that the p-value for the observed statistic of 16 correct matches is 0.1145.
(b) Use the data to calculate a p-value for an observed statistic of 20 correct matches.
(c) Use the data to calculate a p-value for an observed statistic of 14 correct matches.
(d) Which of the three p-values in parts (a) to (c) gives the strongest evidence against H0?
(e) If any of the p-values in parts (a) to (c) indicate statistical significance, which one would it be?
Fantastic news! We've Found the answer you've been seeking!
Step by Step Answer:
a For 16 correct matches pvalue 612 322 142 51 14 410000 ...View the full answer

Answered By
Branice Buyengo Ajevi
I have been teaching for the last 5 years which has strengthened my interaction with students of different level.
1+ Reviews
10+ Question Solved
Related Book For 

Statistics Unlocking The Power Of Data
ISBN: 9780470601877
1st Edition
Authors: Robin H. Lock, Patti Frazer Lock, Kari Lock Morgan, Eric F. Lock, Dennis F. Lock
Question Posted:
