

The histogram shows the distribution of the damage (in billion dollars) of the 30 most costly hurricanes
Question:
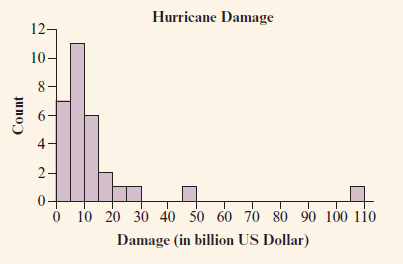
a. Describe the shape of the distribution.
b. Would you use the mean or median to describe the center? Why?
c. Verify with technology that the mean is 13.6, Q1 = 5.7, median = 7.9, and Q3 = 11.8. (Note that different software uses slightly different definitions for the quartiles.)
d. Write a short paragraph describing the distribution of hurricane damage.
The word "distribution" has several meanings in the financial world, most of them pertaining to the payment of assets from a fund, account, or individual security to an investor or beneficiary. Retirement account distributions are among the most...
Fantastic news! We've Found the answer you've been seeking!
Step by Step Answer:
a The distribution is skewed to the right b The median should be used since the distribution ...View the full answer

Answered By
Diane Joyce Pastorin
Please accept my enthusiastic application to solutioninn. I would love the opportunity to be a hardworking, passionate member of your tutoring program. As soon as I read the description of the program, I knew I was a well-qualified candidate for the position.
I have extensive tutoring experience in a variety of fields. I have tutored in English as well as Calculus. I have helped students learn to analyze literature, write essays, understand historical events, and graph parabolas. Your program requires that tutors be able to assist students in multiple subjects, and my experience would allow me to do just that.
You also state in your job posting that you require tutors that can work with students of all ages. As a summer camp counselor, I have experience working with preschool and kindergarten-age students. I have also tutored middle school students in reading, as well as college and high school students. Through these tutoring and counseling positions, I have learned how to best teach each age group.
2+ Reviews
10+ Question Solved
Related Book For 

Statistics The Art And Science Of Learning From Data
ISBN: 9780321997838
4th Edition
Authors: Alan Agresti, Christine A. Franklin, Bernhard Klingenberg
Question Posted:
