

The two tables show 2012 GSS data on whether someone is identified as Democrat, by race and
Question:
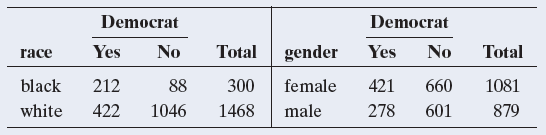
a. Find the difference of proportions between blacks and whites and between females and males. Interpret each. Which variable has a stronger association with whether someone identifies as Democrat, race or gender? Explain.
b. Find the ratio of proportions between blacks and whites and between females and males. Interpret each. Which variable has a stronger association with whether someone identifies as Democrat, race or gender? Explain.
c. Find the odds of identifying as Democrat for blacks and whites and interpret each. Then find the odds ratio and interpret.
Fantastic news! We've Found the answer you've been seeking!
Step by Step Answer:
a 212300 0707 of blacks and 4221468 0287 of whites identify as Democrat The difference between black...View the full answer

Answered By
Utsab mitra
I have the expertise to deliver these subjects to college and higher-level students. The services would involve only solving assignments, homework help, and others.
I have experience in delivering these subjects for the last 6 years on a freelancing basis in different companies around the globe. I am CMA certified and CGMA UK. I have professional experience of 18 years in the industry involved in the manufacturing company and IT implementation experience of over 12 years.
I have delivered this help to students effortlessly, which is essential to give the students a good grade in their studies.
2+ Reviews
10+ Question Solved
Related Book For 

Statistics The Art And Science Of Learning From Data
ISBN: 9780321997838
4th Edition
Authors: Alan Agresti, Christine A. Franklin, Bernhard Klingenberg
Question Posted:
