

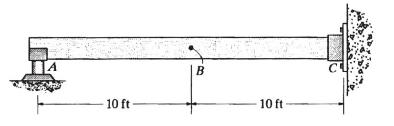
Draw the influence line for the reaction at point (A). Plot numerical values every (5 mathrm{ft}). Assume
Question:
Draw the influence line for the reaction at point \(A\). Plot numerical values every \(5 \mathrm{ft}\). Assume the support at \(A\) is a roller and \(C\) is fixed. \(E I\) is constant.
Fantastic news! We've Found the answer you've been seeking!
Step by Step Answer:

Answered By
Qurat Ul Ain
Successful writing is about matching great style with top content. As an experienced freelance writer specialising in article writing and ghostwriting, I can provide you with that perfect combination, adapted to suit your needs.
I have written articles on subjects including history, management, and finance. Much of my work is ghost-writing, so I am used to adapting to someone else's preferred style and tone. I have post-graduate qualifications in history, teaching, and social science, as well as a management diploma, and so am well equipped to research and write in these areas.
265+ Reviews
421+ Question Solved
Related Book For 
Question Posted:
