

The following graph shows the percent of U.S. homes with a smart television for the years 2013
Question:
The following graph shows the percent of U.S. homes with a smart television for the years 2013 and 2014.
Percent of U.S. Homes with a Smart Television
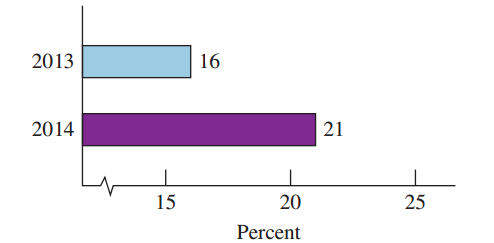
Draw a bar graph that shows the entire scale from 0 to 25.
Fantastic news! We've Found the answer you've been seeking!
Step by Step Answer:
Percent of US Hom...View the full answer

Answered By
Sandip Nandnawar
I am a B.E (Information technology) from GECA and also have an M.C.M from The University of RTMNU, MH.
I worked as a software developer (Programmer and TL). Also working as an expert for the last 6 years and deal with complex assessment and projects. I have a team and lead a team of experts and conducted primary and secondary research. I am a senior software engg and senior expert and deal with all types of CSE and IT and other IT-related assessments and projects and homework.
1+ Reviews
10+ Question Solved
Related Book For 

A Survey of Mathematics with Applications
ISBN: 978-0134112107
10th edition
Authors: Allen R. Angel, Christine D. Abbott, Dennis Runde
Question Posted:
