

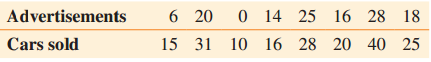
The following table shows the number of weekly television advertisements and the number of cars sold for
Question:
The following table shows the number of weekly television advertisements and the number of cars sold for an 8-week period at a car dealership.
(a) Determine the correlation coefficient between the number of weekly television advertisements and the number of cars sold.
(b) Determine whether a correlation exists at α = 0.05.
(c) Determine the equation of the line of best fit for the number of weekly television advertisements and the number of cars sold.
Round both m and b the nearest hundredth.
Fantastic news! We've Found the answer you've been seeking!
Step by Step Answer:
a b Yes 0920 0707 c X y 15 31 R2 12 225 90 961 62...View the full answer

Answered By
Felix Onchweri
I have enough knowledge to handle different assignments and projects in the computing world. Besides, I can handle essays in different fields such as business and history. I can also handle both short and long research issues as per the requirements of the client. I believe in early delivery of orders so that the client has enough time to go through the work before submitting it. Am indeed the best option that any client that can think about.
5+ Reviews
19+ Question Solved
Related Book For 

A Survey of Mathematics with Applications
ISBN: 978-0134112107
10th edition
Authors: Allen R. Angel, Christine D. Abbott, Dennis Runde
Question Posted:
