

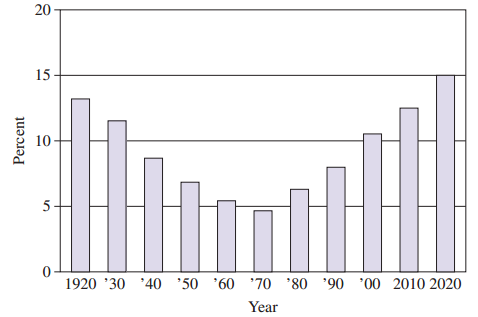
The graph indicates the percentage of the U.S. population that was foreign-born for each decade from 1920
Question:
(a) Use the function f(x) to estimate the percentage of the U.S. population that was foreign-born in 2014. Round your answer to the nearest percent.
(b) Of the years illustrated on the graph, determine the year in which the percentage of the U.S. population that was foreign-born was a minimum.
(c) Determine the x-coordinate of the vertex of the graph of the function f(x). Then use this value in the function f(x) to estimate the minimum percentage of the U.S. population that was foreign-born. Round your answer for the vertex to the nearest whole number. Round your answer for the population to the nearest percent.
Percentage of U.S. Population That is Foreign-Born
Step by Step Answer:
a f94 000494 2 03494 ...View the full answer


A Survey of Mathematics with Applications
ISBN: 978-0134112107
10th edition
Authors: Allen R. Angel, Christine D. Abbott, Dennis Runde
