The odds against the person having A+ blood. The following circle graph shows the percent of Americans
Question:
The odds against the person having A+ blood.
The following circle graph shows the percent of Americans with the various types of blood.
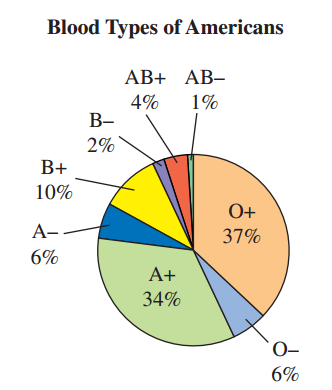
If one American is selected at random, use the graph to determine
Transcribed Image Text:
Blood Types of Americans AB+ AB- 4% B- 2% B+ 10% 0+ A- 37% 6% A+ 34% O- 6%
Fantastic news! We've Found the answer you've been seeking!
Step by Step Answer:
Answer rating: 76% (13 reviews)
6634...View the full answer
Answered By
Mary Njunu
I posses Vast, diversified knowledge and excellent grammar as a result of working in ACADEMIC WRITING for more than 5 years. I deliver work in various disciplines with assurance of quality work. I purpose at meeting the clients’ expectations precisely. Let’s work together for the best and phenomenal grades.
4.90+
928+ Reviews
2551+ Question Solved
Related Book For
A Survey of Mathematics with Applications
ISBN: 978-0134112107
10th edition
Authors: Allen R. Angel, Christine D. Abbott, Dennis Runde
Question Posted:
Students also viewed these Mathematics questions
-
The odds against the person having either A+ or O+ blood. The following circle graph shows the percent of Americans with the various types of blood. If one American is selected at random, use the...
-
The following circle graph shows the percentage of commuters who are frustrated by particular driving situations. Is the graph misleading? Explain. Driving Situations Frustrating to Commuters. Low...
-
The following circle graph shows the percent of the types of books available at Midway Memorial Library. Use this graph for Exercises 15 through 24. 1. What percent of books are nonfiction or...
-
Calculate the following ratios from the data given below: 1. Debt ratio 2. Debt service coverage multiples 3. Interest coverage Balance Sheet 12/31/2014 Assets Cash..$575,000 Short-term...
-
A Federal Reserve Board Report looked at how consumers are using mobile devices throughout their purchase journey. In response to a survey question about mobile device use while shopping, 47% of...
-
To be safe during a lightning storm, it is best to be (a) In the middle of a grassy meadow. (b) Inside a metal car. (c) Next to a tall tree in a forest. (d) Inside a wooden building. (e) On a metal...
-
How can statistical sampling be utilized in making a study of internal control?
-
Siblings Jordan and Morgan Hartley are partners in a trendy toy store called ToyMania! Jordan, as senior partner, receives an annual salary allowance of $20,000 and 60 percent of all income/losses...
-
himself and members of his family who live with him, when he asks you to prepare his 2022 tax return. Mr. Jennings provides you with the following medical expenses and additional information for...
-
1. Identify possible actors and use cases involved in Personal Trainers operations. 2. Create an object relationship diagram for the Personal Trainer information system. 3. Create a use case diagram...
-
The probability that the person has B- blood. The following circle graph shows the percent of Americans with the various types of blood. If one American is selected at random, use the graph to...
-
The odds in favor of the person having B- blood. The following circle graph shows the percent of Americans with the various types of blood. If one American is selected at random, use the graph to...
-
Assume that TCP implements an extension that allows window sizes much larger than 64 kB. Suppose that you are using this extended TCP over a 1-Gbps link with a latency of 100 ms to transfer a 10-MB...
-
7. If we assume labor is the only input to production that can be varied, the relationship between the number of barrels of beer Q (in millions) produced at the Boston Beer Company and the number of...
-
Eutopia and the United States of Pollutia(USP)are both developed countries and both members of the WTO. Eutopia is at the forefront of global efforts to combat climate change. It is also a party to...
-
Osborn Manufacturing uses a predetermined overhead rate of $18.60 per direct labor-hour. This predetermined rate was based on a cost formula that estimates $230,640 of total manufacturing overhead...
-
The MPL in the coffee industry in China is 5 and in the rice industry is 10. The MPL in the coffee industry in Italy is 3 and in the rice industry is 9. China has 1,000 workers while Italy has 1,500...
-
On January 1, 2025, Harrington Company has the following defined benefit pension plan balances. Projected benefit obligation Fair value of plan assets Other data related to the pension plan are as...
-
If there is a cause-and-effect relationship between two variables, then they are ____. But, if two variables are correlated, there is not necessarily a ____ relationship between them.
-
Portal Manufacturing has total fixed costs of $520,000. A unit of product sells for $15 and variable costs per unit are $11. a). Prepare a contribution margin income statement showing predicted net...
-
Use this data set: 8, 9, 5, 4, 7, and 8. Find the following: N
-
Use this data set: 8, 9, 5, 4, 7, and 8. Find the following: X
-
Use this data set: 8, 9, 5, 4, 7, and 8. Find the following: X 2 =
-
Determine "Tyson Food "Company's firmographics, activities, and objectives. Then relate these differences to differences in the organizational cultures of the organizations. or provide detail of any...
-
Wimble Ltd had $400 million of debt outstanding at an interest rate of 9% and $600 million of equity (market value) outstanding. Wimble is subject to a 30% corporate tax rate. What is the amount of...
-
explain and comments thies pints Has existed for a long time One of the original fast-food establishments High standing Commonly recognized for its root beer. With high-quality cuisine Markets to...
Study smarter with the SolutionInn App