

For the US Sankey diagram shown in Figure 12.7. Figure 12.7: Calculate the energy efficiency of power
Question:
For the US Sankey diagram shown in Figure 12.7.
Figure 12.7:
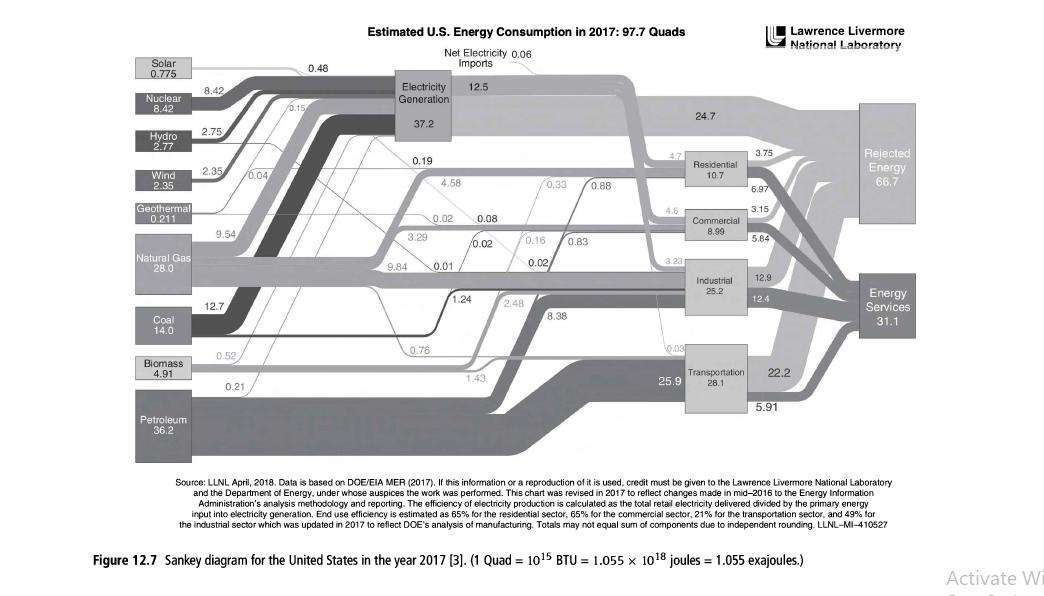
Calculate the energy efficiency of power generation and the four sectors. Obtain the Sankey diagrams for the USA from the cited source for earlier years and compare how the overall energy efficiency and the efficiency of the five activities have changed since 2010.
Fantastic news! We've Found the answer you've been seeking!
Step by Step Answer:
Based on the provided Sankey diagram for the United States in the year 2017 we can calculate the ene...View the full answer

Answered By
BRIAN MUSINGA
I possess a Bachelors of Commerce degree(Marketing option) and am currently undertaking an MBA in marketing. I believe that I possess the required knowledge and skills to tutor in the subject named. I have also written numerous research academic papers much to the satisfaction of clients and my professors.
2+ Reviews
17+ Question Solved
Related Book For 
Sustainable Engineering Principles And Practice
ISBN: 9781108420457
1st Edition
Authors: Bhavik R. Bakshi
Question Posted:
