

Estimate the 25-year and the 100-year peak discharges using the data in Table 13. 12. The map
Question:
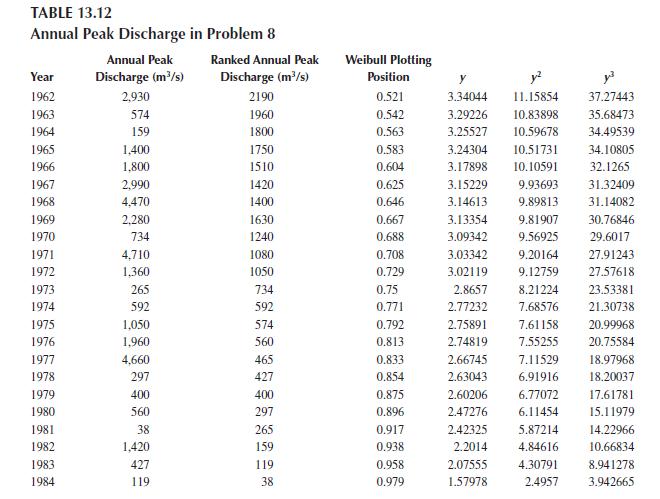
Estimate the 25-year and the 100-year peak discharges using the data in Table 13. 12. The map skew for this location is −0.015.
Fantastic news! We've Found the answer you've been seeking!
Step by Step Answer:

Answered By
Mugdha Sisodiya
My self Mugdha Sisodiya from Chhattisgarh India. I have completed my Bachelors degree in 2015 and My Master in Commerce degree in 2016. I am having expertise in Management, Cost and Finance Accounts. Further I have completed my Chartered Accountant and working as a Professional.
Since 2012 I am providing home tutions.
2+ Reviews
10+ Question Solved
Related Book For 

Water Systems Analysis Design, And Planning Urban Infrastructure
ISBN: 9780367528454
1st Edition
Authors: Mohammad Karamouz
Question Posted:
