

The data presented in Table 12. 14 is the annual maximum series (Qp) and the percentage of
Question:
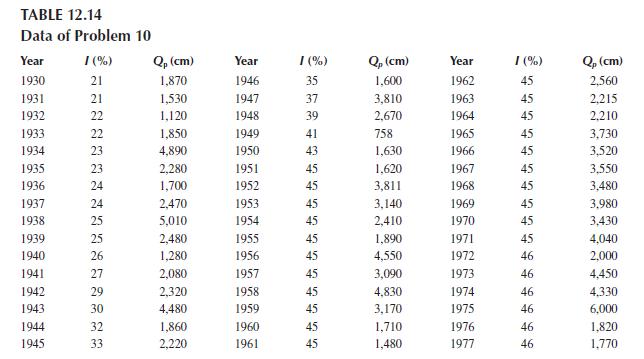
The data presented in Table 12. 14 is the annual maximum series (Qp) and the percentage of impervious area (I) for an urbanized watershed for the period from 1930 to 1977. Adjust the flood series to an eventual development of 50%. Estimate the effect on the estimated 2-, 10-, 25-, and 100-year floods.
Fantastic news! We've Found the answer you've been seeking!
Step by Step Answer:

Answered By
Joseph Njoroge
I am a professional tutor with more than six years of experience. I have helped thousands of students to achieve their academic goals. My primary objectives as a tutor is to ensure that students do not have problems while tackling their academic problems.
10+ Reviews
27+ Question Solved
Related Book For 

Water Systems Analysis Design, And Planning Urban Infrastructure
ISBN: 9780367528454
1st Edition
Authors: Mohammad Karamouz
Question Posted:
