

The Decker Company maintains a fleet of ten service trucks and crews that provide a variety of
Question:
The Decker Company maintains a fleet of ten service trucks and crews that provide a variety of plumbing, heating, and cooling repair services to residential customers.
Currently, it takes on average about six hours before a service team responds to a service request.
Each truck and crew averages twelve service calls per week, and the average revenue earned per service call is $150. Each truck is in service fifty weeks per year.
Owing to the difficulty in scheduling and routing, there is considerable slack time for each truck and crew during a typical week.
In an effort to more efficiently schedule the trucks and crews and improve their productivity, Decker management is evaluating the purchase of a prewritten routing and scheduling software package. The benefits of the system will include reduced response time to service requests and more productive service teams, but management is having trouble quantifying these benefits.
One approach is to make an estimate of how much service response time will decrease with the new system, which then can be used to project the increase in the number of service calls made each week. For example, if the system permits the average service response time to fall to four hours, management believes that each truck will be able to make sixteen service calls per week on average—an increase of four calls per week. With each truck making four additional calls per week and the average revenue per call at $150, the revenue increase per truck per week is $600 (4
$150). With ten trucks in service fifty weeks per year, the average annual revenue increase will be $300,000
($600 × 10 × 50).
Decker Company management is unsure whether the new system will enable response time to fall to four hours on average or if it will be some other number.
Therefore, management has developed the following range of outcomes that may be possible outcomes of the new system, along with probability estimates of each outcome’s occurring.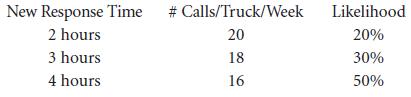
Given these figures, prepare a spreadsheet model that computes the expected value of the annual revenues to be produced by this new system.
Step by Step Answer:


Systems Analysis And Design With UML 2.0
ISBN: 9781118037423
4th Edition
Authors: Alan Dennis, Barbara Haley Wixom, David Tegarden
