

The frequencydischargestoragedamage data for existing conditions at a particular area along a river is given in Table
Question:
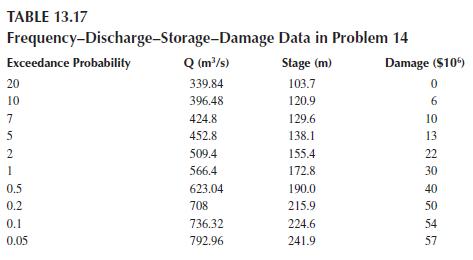
The frequency–discharge–storage–damage data for existing conditions at a particular area along a river is given in Table 13. 17. The storage–discharge data make up the rating curve, the discharge–frequency data compose the frequency curve, and the storage–damage data make up the storage–damage curve. Plot these three relationships.
Step by Step Answer:

This question has not been answered yet.
You can Ask your question!
Related Book For 

Water Systems Analysis Design, And Planning Urban Infrastructure
ISBN: 9780367528454
1st Edition
Authors: Mohammad Karamouz
Question Posted:
