

The reverse-saturation current for each diode in Figure P1.42 is (I_{S}=10^{-14} mathrm{~A}). Use a computer simulation to
Question:
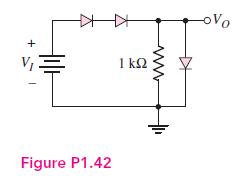
The reverse-saturation current for each diode in Figure P1.42 is \(I_{S}=10^{-14} \mathrm{~A}\). Use a computer simulation to plot the output voltage \(V_{O}\) versus the input voltage \(V_{I}\) over the range \(0 \leq V_{I} \leq 2.0\mathrm{~V}\).
Figure P1.42:-
Step by Step Answer:

This question has not been answered yet.
You can Ask your question!
Related Book For 
Microelectronics Circuit Analysis And Design
ISBN: 9780071289474
4th Edition
Authors: Donald A. Neamen
Question Posted:
