

The periodic sawtooth wave in Figure P13-20 drives the OP AMP circuit shown in the figure. (a)
Question:
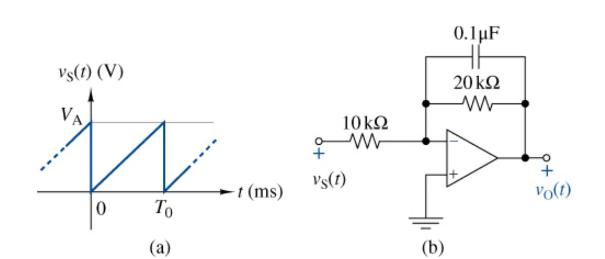
The periodic sawtooth wave in Figure P13-20 drives the OP AMP circuit shown in the figure.
(a) Use the results in Figure 13-4 in the text to find the Fourier coefficients of the input for \(V_{\mathrm{A}}=3 \mathrm{~V}\) and \(T_{\mathrm{o}}=4 \pi\) \(\mathrm{ms}\).
(b) Find the first four nonzero terms in the Fourier series of \(v_{\mathrm{O}}(\mathrm{t})\).
(c) Simulate the circuit using Multisim. Use the triangular source and make the fall time very short ( \(0.1 \mathrm{ps})\). Plot three cycles of the output. The voltage limit for the OP AMP is \(V\) \(\mathrm{CC}= \pm 15 \mathrm{~V}\). Explain why the plot looks like it does.
Fantastic news! We've Found the answer you've been seeking!
Step by Step Answer:
a b c Using the results in Fi...View the full answer

Answered By
YOGENDRA NAILWAL
As I'm a Ph.D. student, so I'm more focussed on my chemistry laboratory. I have qualified two national level exams viz, GATE, and NET JRF (Rank 68). So I'm highly qualified in chemistry subject. Also, I have two years of teaching experience in this subject, which includes college teacher as well as a personal tutor. I can assure you if you hire me on this particular subject, you are never going to regret it.
Best Regards.
1+ Reviews
10+ Question Solved
Related Book For 

The Analysis And Design Of Linear Circuits
ISBN: 9781119913023
10th Edition
Authors: Roland E. Thomas, Albert J. Rosa, Gregory J. Toussaint
Question Posted:
