

The top view of a processing line in an industrial facility is shown in Figure P1.19A. The
Question:
The top view of a processing line in an industrial facility is shown in Figure P1.19A. The processing line machinery and thermal equipment are located in the gray area. Water is to be supplied to the processing line at points A, B, and C. The water source is an elevated tank that is kept full by a pump controlled by a waterlevel sensor in the tank. The water source is available at point S. Points A, B, C, and S are all at the same elevation.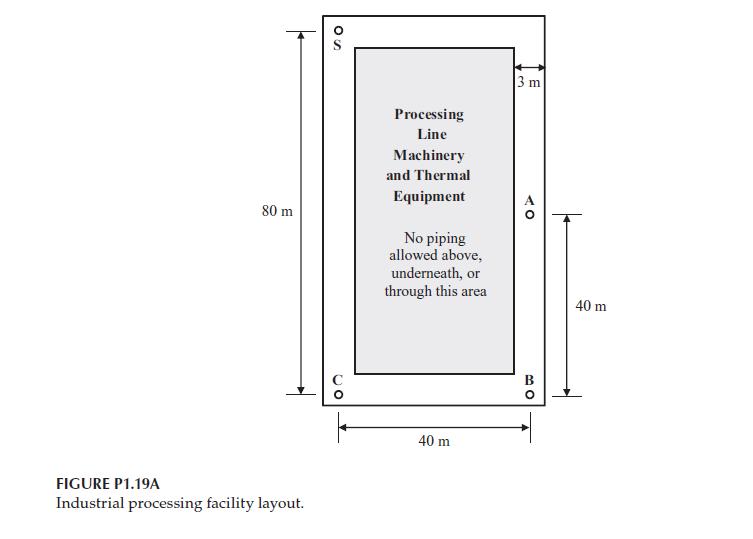
The water demand at each point is, 2.5 L/s at A, 3.5 L/s at B, and 1.5 L/s at C.
The water demand for points A and C occur intermittently, although they may coincide. The demand at points A and C occurs only during the working shifts.
The water demand at point B occurs during the non-shift hours and is also intermittent.
Piping can only be installed in a 3-m wide space around the processing line. No piping is allowed above, underneath, or though the processing area.
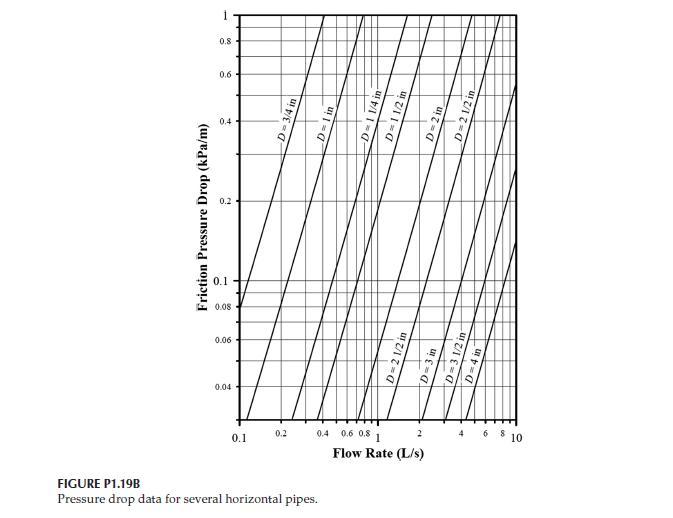
The calculated friction pressure drop (kPa/m) for various pipe diameters is shown in Figure P1.19B. These curves are computed for horizontal pipes. Losses due to fittings can be considered negligible. The performance curves of nine potential pumps for this application are shown in Figure P1.19C. These curves show the pressure increase across the pump as a function of the flow rate through the pump. The pump performance curves are drawn over a range of acceptable operating efficiency.
Design a pipe system for this application. Provide a sketch of the piping network and specify the information about the system by completing a table similar to Table P1.19.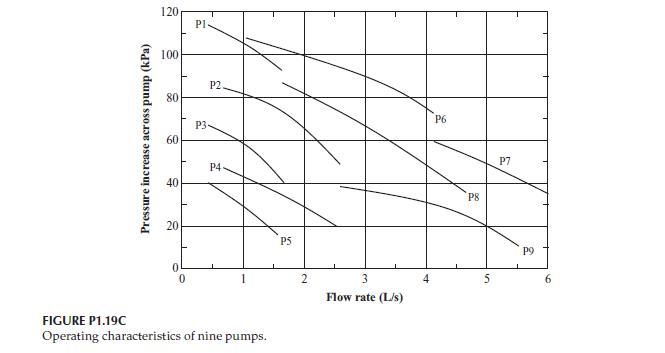
Step by Step Answer:

This question has not been answered yet.
You can Ask your question!


Thermal Energy Systems Design And Analysis
ISBN: 9781138735897
2nd Edition
Authors: Steven G. Penoncello
