

A review of the performance of hospital gynecologists in two regions of England measured the outcomes of
Question:
A review of the performance of hospital gynecologists in two regions of England measured the outcomes of patient admissions under each doctor’s care (Harley et al. 2005). One measurement taken was the percentage of patient admissions made up of women under 25 years old who were sterilized.
We are interested in describing what constitutes a typical rate of sterilization, so that the behavior of atypical doctors can be better scrutinized. The frequency distribution of this measurement for all doctors is plotted in the following graph.
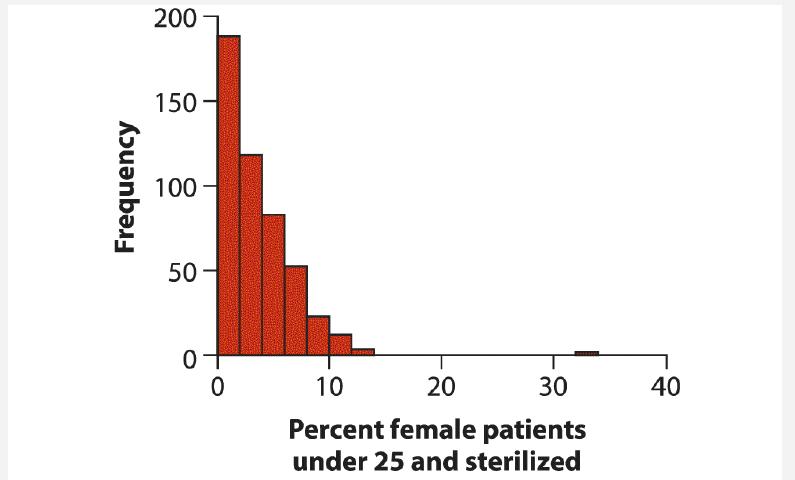
a. Explain what the vertical axis measures.
b. What would be the best choice to describe the location of this frequency distribution, the mean or the median, if our goal was to describe the typical individual? Why?
c. Do you see any evidence that might lead to further investigation of any of the doctors?
Step by Step Answer:
a The number of doctors studied who sterilized a given percent...View the full answer


The Analysis Of Biological Data
ISBN: 9781319226237
3rd Edition
Authors: Michael C. Whitlock, Dolph Schluter
