

Calculation practice:x 2 goodness-of-fit test to a Poisson distribution. Your friend is writing a computer program to
Question:
Calculation practice:x2 goodness-of-fit test to a Poisson distribution. Your friend is writing a computer program to place individuals randomly on a spatial landscape, where every individual is placed independently of all the others and probability is equal everywhere.
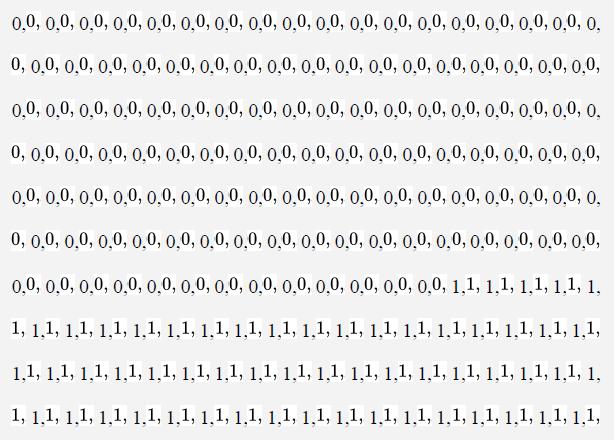
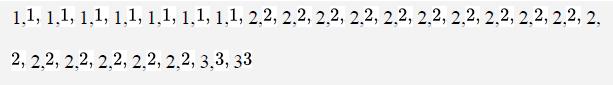
He finds that many of the individuals land near each other and many other areas are empty, and he becomes concerned that the program is not behaving as intended. You offer to check his results against the Poisson distribution, which is the expected distribution for the number of individuals in equal-area blocks placed over the landscape according to his assumptions. The following data show the number of individuals placed by the program into 200 such blocks. We’ve ordered the numbers for your convenience.
a. Explain why the Poisson distribution is the appropriate distribution to compare these results to.
b. Write the null and alternate hypotheses for this test.
c. Make a frequency table for the data.
d. Calculate the mean number of individuals per area in the data.
e. Using this mean, calculate the probability of 0, 1, 2, and 3 individuals per block assuming a Poisson distribution.
f. Calculate the expected numbers of blocks with zero to three individuals.
g. Calculate the probability of a block with four or more individuals.
h. Are the expected values from part (f) suitable for the x2 goodness-offit test? Consider the requirements of the x2 test for the minimum expected values.
i. Combine categories (if necessary) to meet the minimum expected value requirements for the x2 test.
j. How many degrees of freedom will this test have?
k. Calculate the x2 test statistic with the observed and expected values.
l. Find the critical value and determine an approximate P-value for this test. (Here and always, provide an exact PP if you are using a computer to answer this question.)
m. Interpret this result in terms of the original hypotheses and the question asked of the data.
Step by Step Answer:
a Because the computer program encodes the assumptions of the Poisson d...View the full answer


The Analysis Of Biological Data
ISBN: 9781319226237
3rd Edition
Authors: Michael C. Whitlock, Dolph Schluter
