

Dispersal and the movement distance of organisms are sometimes described using a probability distribution known as the
Question:
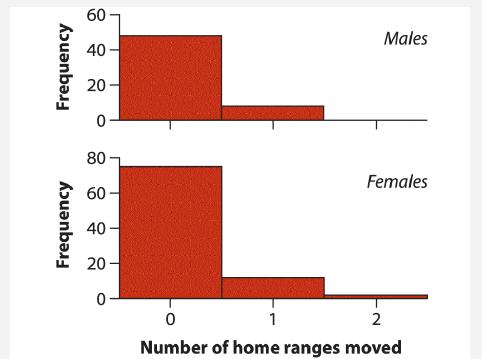
Dispersal and the movement distance of organisms are sometimes described using a probability distribution known as the geometric distribution (see Practice Problem 7). For example, the following histograms show the number of home ranges separating the locations where individual male and female field voles, Microtus agrestis, were first trapped, and the locations they were caught in a subsequent trapping period (Sandell et al. 1991). A home range is the area normally used by an individual during its normal daily life. Most individuals didn’t move at all, a few moved just one home range away, and a small fraction moved two home ranges.
If these frequencies are described by a geometric distribution, then the fraction of observations in the first category (here, i=0 ) is given by the parameter p. The fraction in the second category (i=1) is (1−p)p. The fraction in the third category (i=2) is (1−p)2p, and so on, yielding Pr[i]=(1−p)ip, where i is 0, 1, 2, or more. Maximum likelihood methods can be used to estimate the parameter p from the data. The log-likelihood formula for p is ln L[p |data]=ln[1−p](Σiifi)+n ln[p], where fi is the frequency of observations corresponding to i=0, 1, 2, and so on.
a. Forty-eight of 56 male voles stayed put (i=0), whereas the remaining eight moved one home range. Using a computer program, calculate the log-likelihood of values of p between 0.70 and 0.99 with intervals of 0.01. Draw the relationship between the loglikelihood and p with a log-likelihood curve.
b. Find the maximum likelihood estimate p^ for male voles to two decimal places.
c. Obtain a likelihood-based 95% confidence interval for p.
Data from Practice Problem 7
A regulatory gene controls the expression of other genes—it turns them on and off. Many of these targets are themselves regulatory genes, instructing genes to turn on or off. Guelzim et al. (2002) determined the number of regulatory genes controlled by a sample of genes in yeast. Their data are listed in the following table.
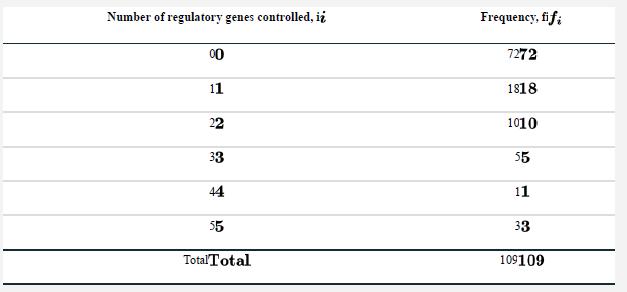
The shape of this frequency distribution suggests that it might be approximated by a probability distribution known as the geometric distribution. Under a geometric distribution, the fraction of genes controlling no regulatory genes (here, i=0 ) is p. The fraction controlling exactly one regulatory gene (i=1) is (1−p)p. The fraction controlling exactly two regulatory genes (i=2) is (1−p)2p, and so on, yielding Pr [i]=(1−p)ip, where i is 0, 1, 2, or more. Maximum likelihood methods can be used to estimate the parameter p, the fraction controlling no regulatory genes, from data. The log-likelihood formula for p is ln[L[ p | data]]=ln[1−p](Σii fi)+n ln[p], where fi is the frequency of observations corresponding to i=0, 1, 2, and so on, and n is the total sample size.
Step by Step Answer:
python import numpy as np from scipystats import binom import matplotlibpyplot as plt Frequency data for male voles frequencies male 0 48 1 8 Total nu...View the full answer


The Analysis Of Biological Data
ISBN: 9781319226237
3rd Edition
Authors: Michael C. Whitlock, Dolph Schluter
