

Each of the following graphs illustrates an association between two variables. For each graph, identify: (1) The
Question:
Each of the following graphs illustrates an association between two variables. For each graph, identify:
(1) The type of graph,
(2) The explanatory and response variables, and
(3) The type of data (whether numerical or categorical) for each variable.
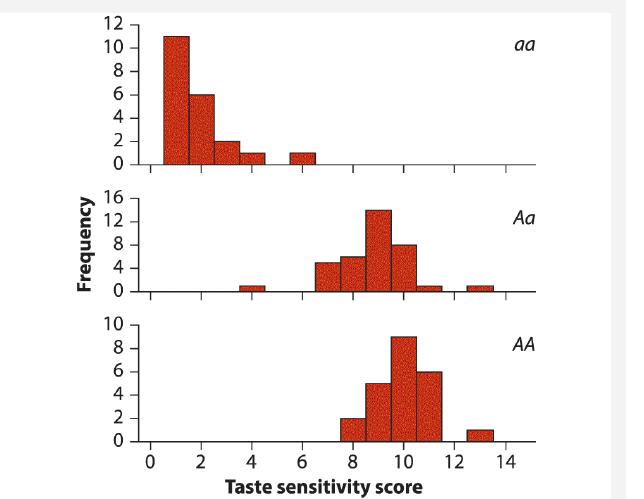
a. Taste sensitivity to phenylthiocarbamide (PTC) in a sample of human subjects grouped according to their genotype at the PTC gene—namely, AA, Aa, or aa (Kim et al. 2003):
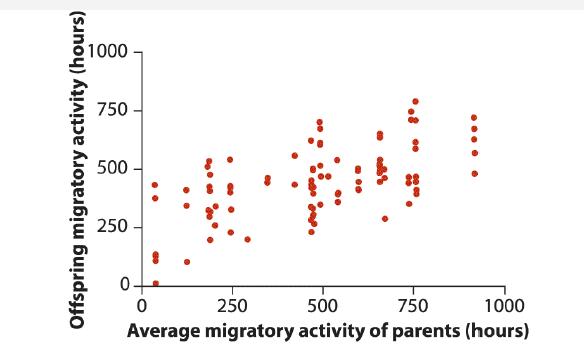
b. Migratory activity (hours of nighttime restlessness) of young captive blackcaps (Sylvia atricapilla) compared with the migratory activity of their parents (Berthold and Pulido 1994):
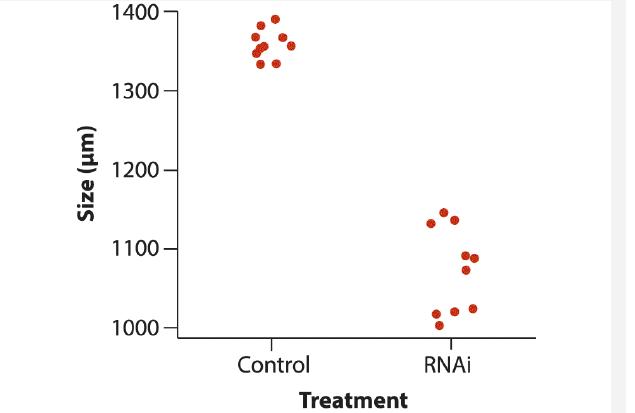
c. Sizes of the second appendage (middle leg) of embryos of water striders in 10 control embryos and 10 embryos dosed with RNAi for the developmental gene Ultrabithorax (Khila et al. 2009):
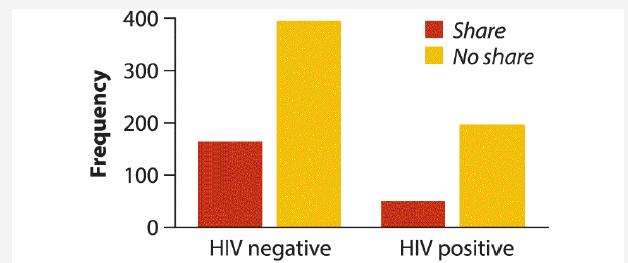
d. The frequency of injection-heroin users who share or do not share needles according to their known HIV infection status (Wood et al. 2001):
Step by Step Answer:
a Multiple histograms Explanatory variable genotype ...View the full answer


The Analysis Of Biological Data
ISBN: 9781319226237
3rd Edition
Authors: Michael C. Whitlock, Dolph Schluter
